Integrating Data Refinery with Third Party Dashboard Services
Data Refinery offers an easy-to-use interface to connect with popular third-party dashboard services such as Sisense, Tableau, and Power BI. Dashboards offer users an effective way to visualize data, and gain insights such as changes in data trend, enrichment progress, and data outliers.
Table of contents
Dashboard Service Options
There are many third-party dashboard services available on the market, and most of them can be used with Data Refinery as a data source. Data Refinery recommends Sisense if the user does not have an existing dashboard service.
Compatibility can be verified by checking if the tool supports connection with Amazon Redshift as a data source. In some cases, if the selected dashboard tool does not support Amazon Redshift but supports generic SQL connections, it could still be connected with Data Refinery with limited features. Contact Kingland support to verify compatibility.
Prerequisite
This section contains necessary prerequisite steps needed before connecting Data Refinery to a third-party dashboard service.
Loading Data
To access data from a dashboard service, it must be loaded into a Source first. See the How to Create a Source and How to Upload Data pages.
Once data is loaded, ensure the Source is assigned under at least one Project. Finally, verify the Source can be queried using the data preview API/UI.
Creating a Connection User
As a security best practice, create a dedicated Data Refinery user and grant the user the Analyst role on all Projects that are used for the dashboard. The user’s username and password will be used to authenticate to the database.
Tip. An SSO user can be used for a dashboard connection as well. However, the user’s Redshift password must be reset first. See the Reset Redshift Password page to learn more.
Note. For security, do not use the
system_adminuser’s credential when connecting to a third-party dashboard service.
Ensure Network Connectivity
For self deployed instances of Data Refinery on a private network or VPC, the Redshift Database must be accessible to the dashboard service.
Connect to a Dashboard Tool
This section contains steps to connect Data Refinery to a third-party dashboard tool. Verify all prerequisite steps are completed before proceeding.
Note. Sisense is used as an example tool. The following steps should be similar for other tools.
Create a Model
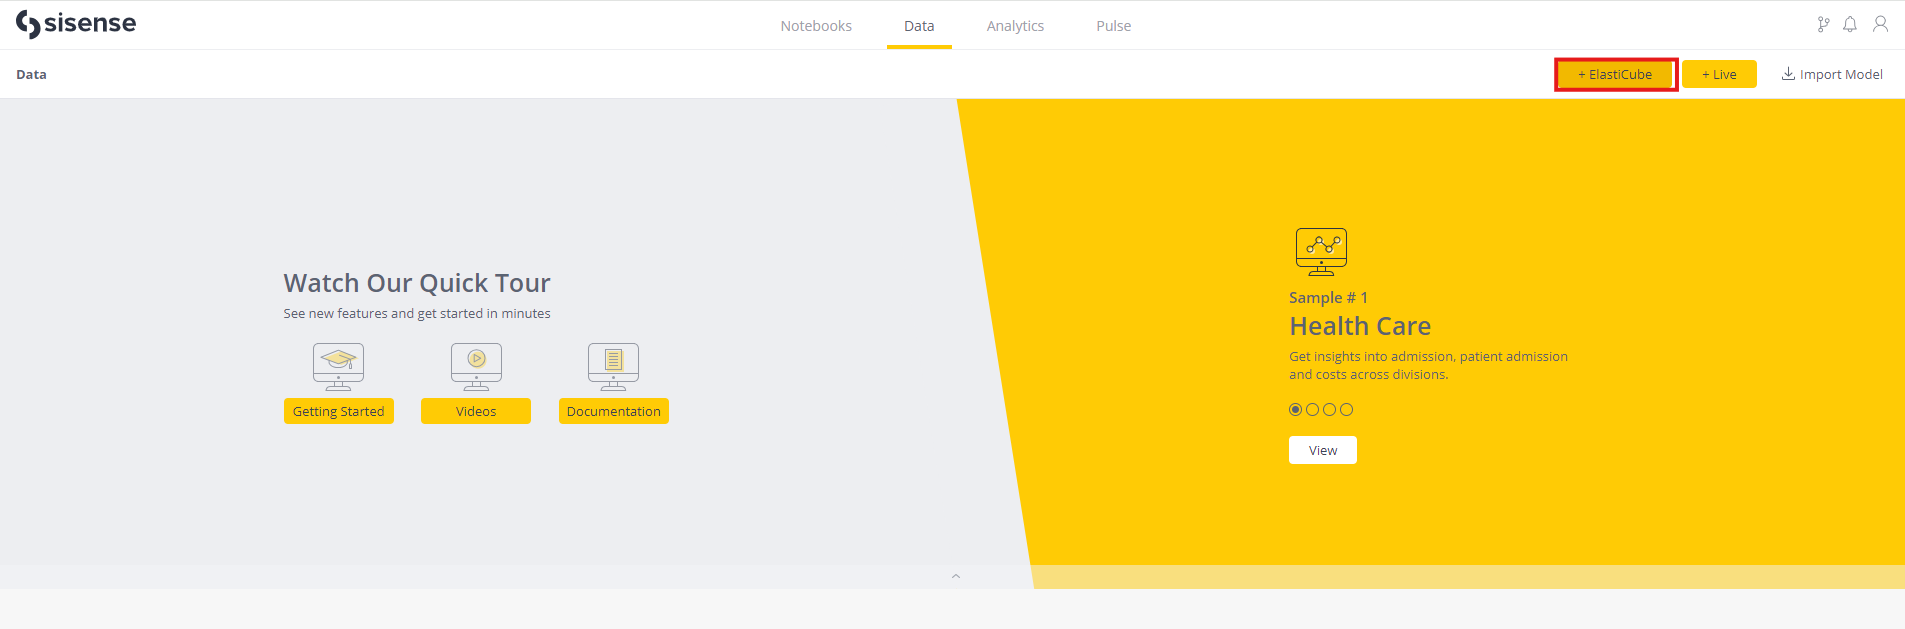
In Sisense, Models are used to organize multiple sources of data. Subsequently, dashboards can be built using data from the Models. Sisense has two types of Models available, ElastiCube and Live. Data Refinery recommends Elasticube Models for best performance and query flexibility. For more guidance on choosing Model type, refer to the Sisense documentation.
Connecting to the Data Refinery Database
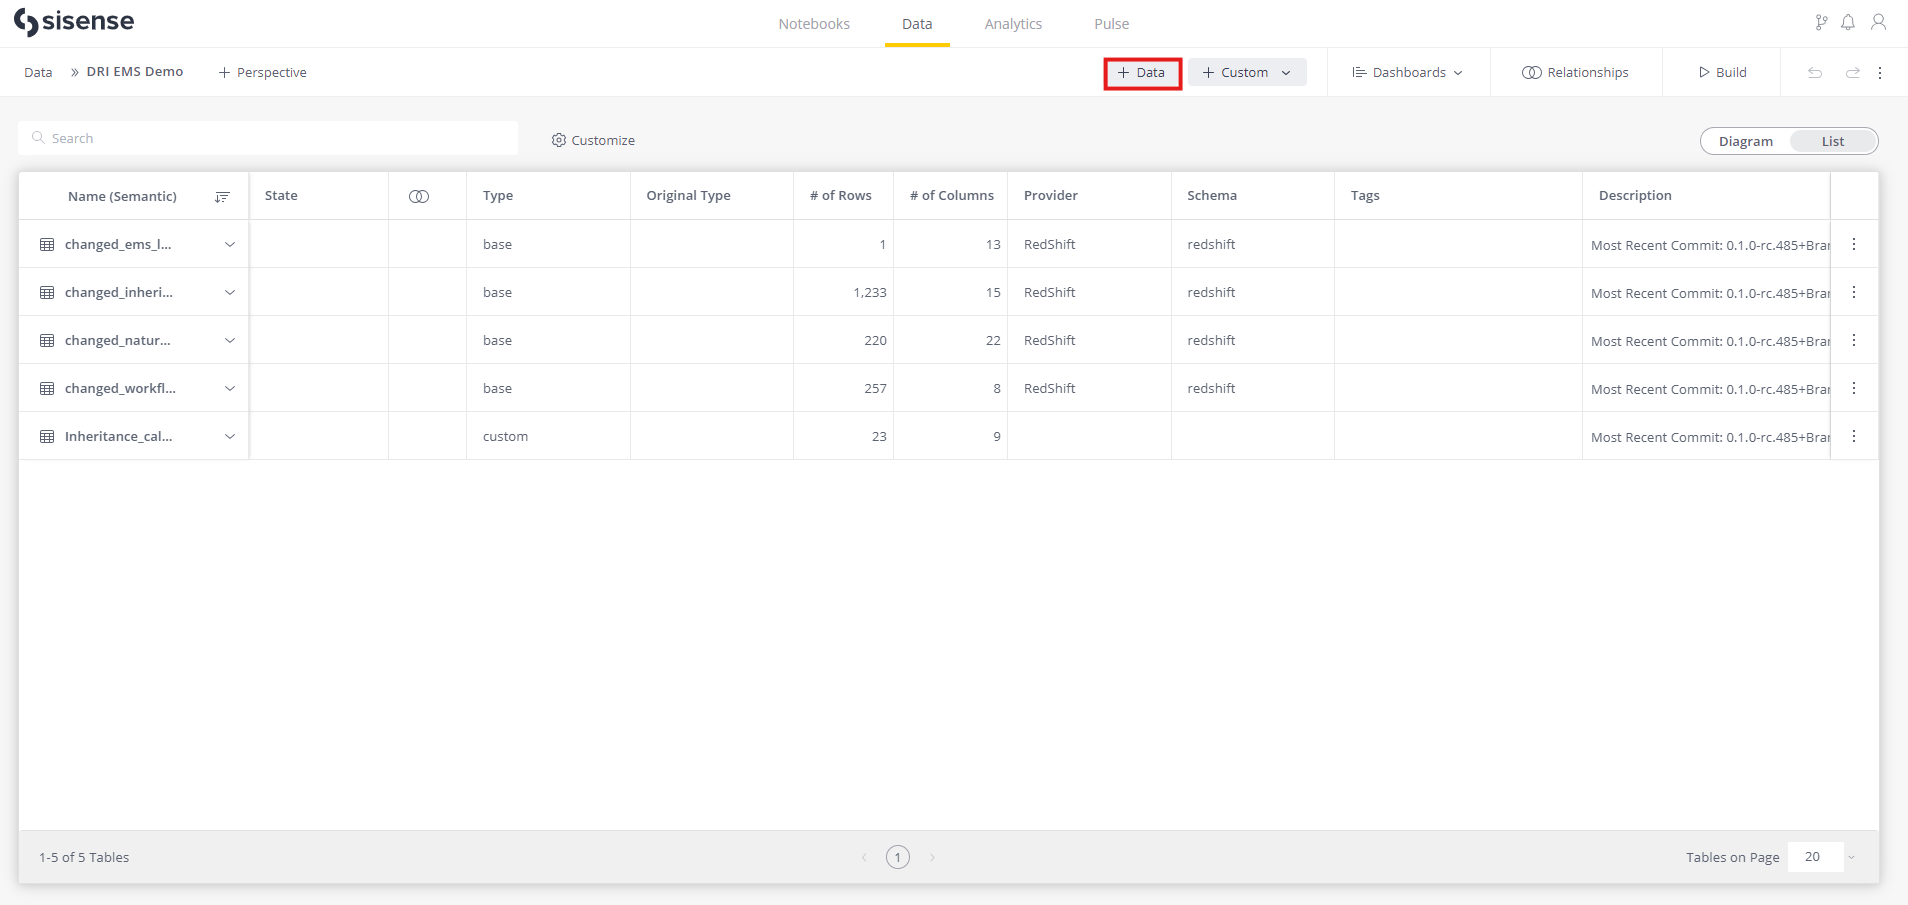
Once a Model is created, users can create a connection with Data Refinery. This may also be called “Provider” or “Data Source” in different tools.
In Sisense, click the + Data button.
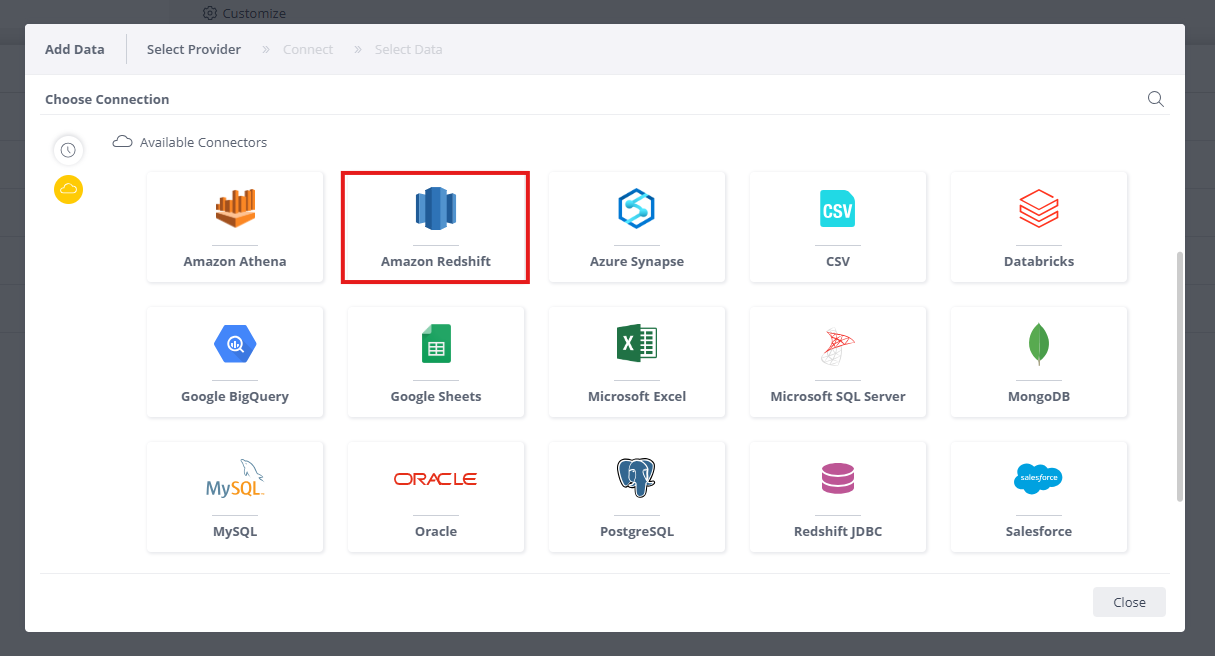
When prompted, choose Amazon Redshift as connection type.
Next, configure the connection using the credentials from Data Refinery:
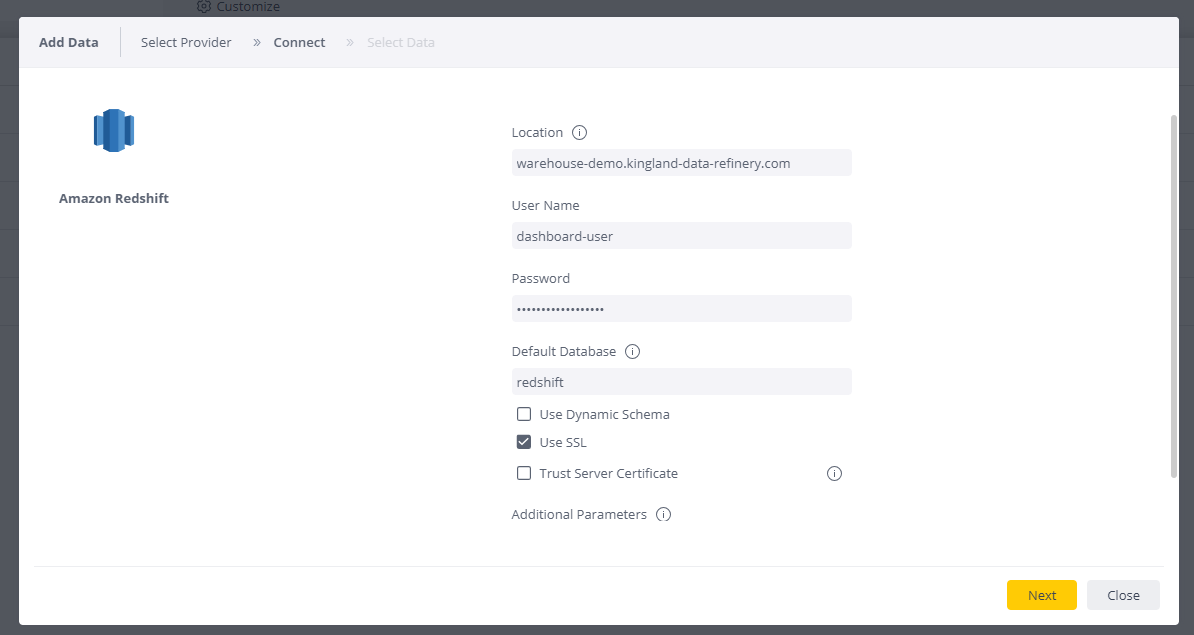
- Location/Database URL: this can be found in Data Refinery Designer UI. Click on the username and locate the “Database Host” field.
- User Name: the connection user’s username.
- Password: the connection user’s Redshift password, which may be the same as the API/UI password.
- Default Database: “redshift”
- Use SSL: select this checkbox to enable encrypted connections.
Then, click Next.
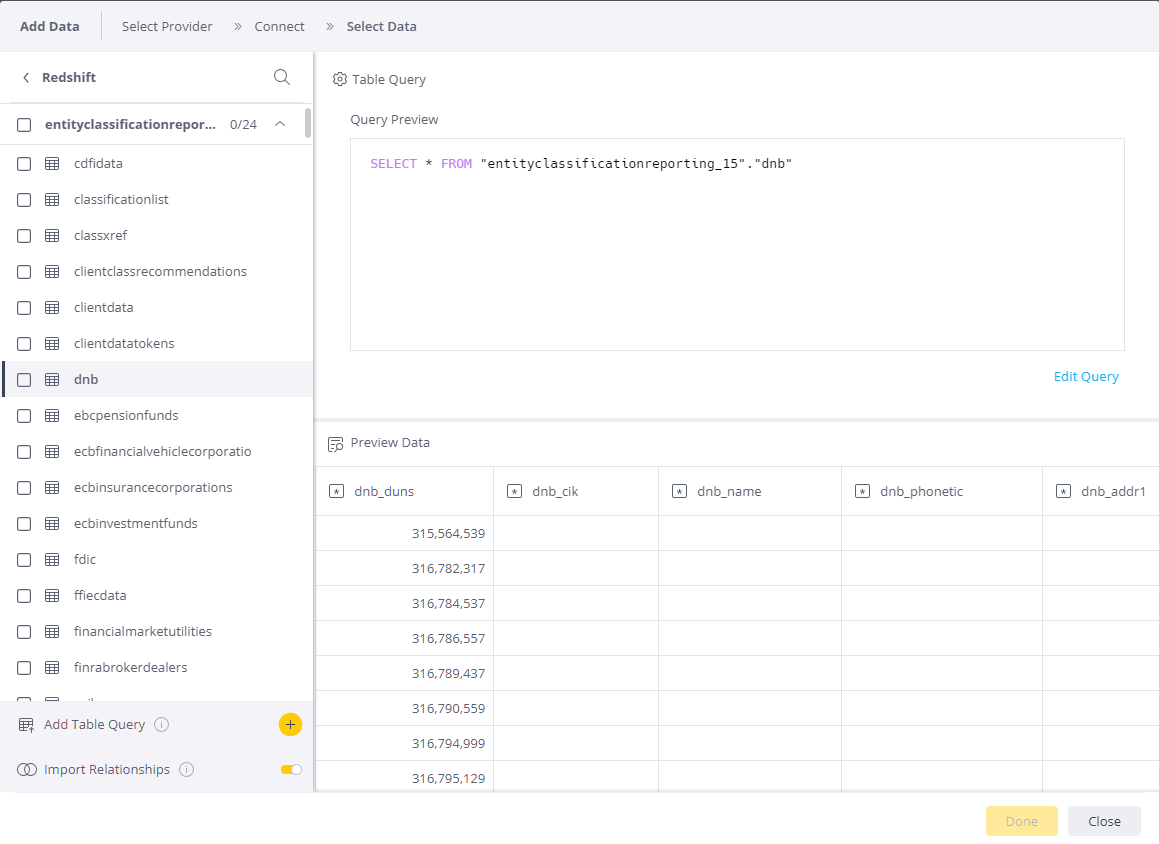
The connection will be validated and a list of databases and schemas should be available for querying to generate dashboards. Tables can be imported directly. Alternatively, custom queries can be used to filter or pre-process the data using the “Add Table Query” tab.
Querying Data
Once a connection is made with Data Refinery database, users can query data from Data Refinery using standard SQL syntax. View the Redshift and Glue Best Practices page for general guidance on data querying. Below are some specific best practices for dashboard queries.
Versioned Data
Data Refinery Sources automatically appends a version column to all schemas. The version column corresponds to the Source’s Version number. Often only the latest version of the data is desired. The following query provides an example to filter the data by latest version only.
Note. the
versioncolumn is always astringtype, so it must be cast tointegerfirst.
SELECT
	entity.id, entity.name, entity.country
FROM
	drf1.entity
WHERE
	entity.version = (select max(cast(v.version as integer)) from drf1.entity v))
Combining Data From Multiple Sources
To load data from different Sources to a dashboard, queries can be constructed to unify the data first with standard SQL JOIN statements. All Sources for a dashboard should be placed in the same Sisense Model. The following query provides an example to join reference data onto a list of entities.
WITH reference_data AS (
	SELECT
		r.id,
		rd.category,
		rd.displaykey
	FROM
		drf1.referencedata rd
	WHERE
		rd.version = (
		select
			max(cast(rdv.version as integer))
		from
			drf1.referencedata rdv))
SELECT
	entity.id,
	entity.name,
	domicile.displaykey as domicile_name
FROM
	drf1.entity entity
LEFT JOIN reference_data domicile on
	entity.domicilecode = domicile.id